Towards Data Science
Hi – I am Troy Sadkowsky, and I am the resident data scientist in the QUT Social Media Research Group. How I became known as a data scientist is an interesting story (and quite accidental). After graduating with a degree in IT and Science I worked my way through the ranks from scientific programmer to project manager. But it wasn’t until I got my MBA and set up as a professional scientific software developer that I was really able to excel in the field (a field that I had no idea existed). By servicing a large variety of needs within an array of domains really developed the capability to be nimble, focused and direct. And after a few years of delivering cool data-driven software tools that ranged from helping scientists predict new drug molecular structures to helping cancer researchers turn research years into months, people started saying to me “Hey you know what you are? Your a data scientist!”. So I took on the title and haven’t looked back. Just having the name has brought about a focus and direction of its own. At the QUT Social Media Research Group I enjoy the level of innovation that is required when working with interdisciplinary researchers that are deeply theorising about the forces from which the whole of humankind construct their daily lives.
However, I still get the question “what is data science?”, so here is an overview of a recent presentation I did for a Digital Marketing event where I talked about the value of data science and how data can be an asset for businesses through service multiple levels of the organisation.
As a data scientist I work with data to build tools that support us in making better decisions about how we live our lives. My data science work has brought me to a large variety of environments in which I’ve enjoyed being a data scientist. I’ve worked with epidemiologists in building artificial intelligence tools to help them identify causes of cancer, I’ve helped construction company managers build reporting tools to identify real-time job costs and charges, and most recently I’ve been working with interdisciplinary researchers from QUT in the collection, analysis and visualisation of social media data to help them theorise about the forces from which humankind construct their daily lives.
In the next two years we will create the same amount of digital data that has been created since the beginning of time up until now. The world’s data doesn’t just hold the pool of human knowledge that we call facts; it also holds information about our feelings, our growth, our relationships and interactions with each other and the world.
With all this data, it is becoming an increasing challenge to filter out the information that we need to know from the information that we don’t need to know, which is to say – to filter out the signal from the noise. Due to the volume, velocity and variety of these signals it is getting increasingly difficult to derive meaning from them in a timely manner. The speed at which they are being created can easily be greater than the speed at which we can notice them. Without the right equipment it can be like trying to count the spokes on a spinning wheel.
However, those who can do it are building empires on the value that the data brings. Companies like Google, Wikipedia, Twitter and Facebook cashing in on the value of connecting data with data and sharing that with people.
Jimmy Wales’s vision of making the sum of all human knowledge freely accessible to every single person is well on its way. And whereas Wikipedia serves us with the common facts, online social media is serving us with the personal facts… and in real time. Twitter’s mission is to instantly connect people everywhere to what’s most important to them. Facebook’s mission is to give people the power to share and make the world more open and connected. Google’s mission is to organise the world’s information and make it universally accessible and useful. The high level of success that these companies have achieved is a showcase for what can be achieved with a company mission focussed on organising and delivering data. It is working well for them and there is no reason why it can’t work for us too.
Data is simply data. The commonality of data can level the playing fields, remove boundaries and provide a language that can bring about a common understanding. And the data is flowing free like the water flows down our rivers. All you need to do is get to the water and start processing it in a way that is right for you.
Data could be both the biggest opportunity and the biggest challenge of our modern age.
Imagine being able to know everything that you want to know. Want to know the current temperature in Hawaii, want to know the stock price of Apple Inc., want to know the average house price in New Zealand? And if the information is not there, then what you most often find in its place are some instructions on how to go get it or create it for yourself.
Information is being made available in large quantities, and the future predicts more information to come.
Modern technology is capturing the data and modern culture is sharing it more openly. Together our data and our share-alike culture are rapidly growing the world’s data ecosystem, and this is simultaneously revolutionising the way we interact with each other and the world. It is revolutionising the way we get our news, the way we get our education, the way we are entertained, and the way we do business.
Looking at Twitter alone, we see how social media can impact journalism by turning twitter users into 24-hour citizen journalists. Twitter opens a marketing channel to 600 million people. It enables you to build ongoing customer relationships and insights about what your customers want. Recent social media and big data analysis research performed at the CCI found that the rate of new Twitter accounts is 833 every minute – more on this in a future blog post.
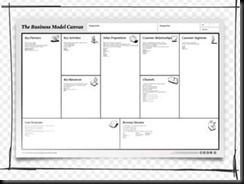
And if it is happening in the external world, it is very likely that it is happening internally within your organisation. Your organisation’s data ecosystem is made up of a number of key areas that are required for you to maintain a successful business. Using the Business Model Canvas we can take a holistic view of these key areas. The Business Model Canvas is a strategic management and entrepreneurial tool that helps you to describe your business model and is a great way to bring forth awareness of the data assets within it.
 In your organisation you have information about your customers, your service or product, your delivery of that service or product, your internal and external interactions, your tools and resources, your activities, your partners, your costs and your revenue. These data assets – once identified, mapped and tracked over time – enable deep insights to be discovered about what is important for growth and wellbeing of your organisation. It can show surprising information about the dependent relationship that each data asset has on the other. If you have an average ecosystem, you will produce average results.
Data ecosystems can look like neatly pastured farm fields or they can look like chaotic overgrown rainforests. In either case it is important to maintain the high-value data assets within. Maintaining your high-value data assets is quite easy, all you need to do is regularly ask questions of them. Look at a high level diagram of your data ecosystem and start listing some quality questions you could regularly ask of it. For example, what would happen to your 12 month revenue if you doubled your sales staff? What would it take to double your productivity? What is the cause or your major frustration right now? If the answers are not there then you need take action to ensure there are there. Behind your high quality questions are the high value data assets. And just as it is important to read between the lines, when it comes to data you need to look beneath the numbers.
Overall, then, data is available to your organisation from both internal and external sources. With the volume, velocity and variety of data available via the Internet, it seems that we are all now in the business of big data. You have the tools and data available to you to gain insights. Your insights will help you to move more efficiently towards achieving your business goals. All you need is a plan that brings them together. By establishing a data ecosystem diagram your data assets become more real and enable you to look beneath the numbers. Start now by identifying what the number one question is that you could ask of your data.
One more thing.
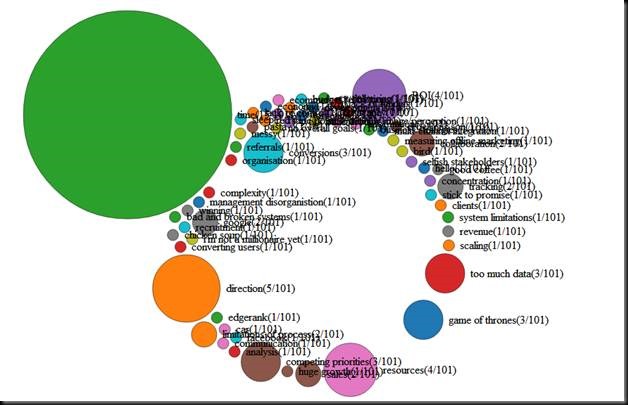
Here are the results of the data science experiment that I performed in the presentation, where I asked the 100+ business professionals that attended “what was there number one frustration right now?” Click on the graph for an interactive visualisation, and explore…